Keyword Tracking For Enterprise SEO: Scale, Segmentation, & Real Searcher Data
Keywords
Search Engine News & Info


One of the most powerful keyword tools on the market is free, available to everyone, and filled with data from real searcher queries. We’re talking about Google Search Console.

We’re going to take a deep dive into how to use Google Search Console’s keyword data, what the metrics mean, and answer some of the most common questions about the tool.
If you’re already familiar with the Performance report and want to get to the advanced questions and use cases, feel free to skip down to the sections on “Example use cases” or “Common questions.”
The Google Search Console Performance report shows you how your site performs in Google Search Results. You can access it by navigating to your verified property in Google Search Console, then clicking “Performance” in the left navigation.
The metrics Google uses to show you how your site is performing are clicks, impressions, CTR, and average position. The Performance report also has extensive filtering options and also gives you the option to view your data by certain dimensions.
Google Search Console’s Performance report has four main metrics: clicks, impressions, average CTR, and average position. You can view these metrics by individual URL (e.g. how many clicks a certain page is getting) or the average of multiple URLs (e.g. how many clicks you’re getting total across all pages).
The data in Google Search Console is fresh too, showing data as recent as less than a day old.
A click in Google Search Console is counted any time a searcher clicks on one of your URLs from the SERP and is taken to a page outside of Google Search. Google explains that, if a searcher clicks something that keeps them on a Google property (such as query refinements), that is not counted as a click. No need to get overly complicated though — it’s sufficient just to know that any time someone clicks on one of your URLs in the search results and is taken to your website, that counts as a click.
An impression in Google Search Console happens whenever that URL appears in a search result for a searcher.
A URL can get impressions even when it shows up “below the fold,” meaning a searcher would have to scroll to see the result, regardless of whether or not the searcher scrolled the URL into view.

A URL will not get the impression if it’s listed on page 2+ unless the searcher actually clicks through to those deeper pages of search results.
CTR stands for “click-through rate,” and it’s a metric that tells you how often people who see your URL in search results end up clicking it. To calculate CTR, Google divides your clicks by your impressions. So, for example, if your URL has 1,000 impressions and 100 clicks, your CTR would be 10%.
Average position is the numerical order in which Google displays a URL in search results. According to Google, “Position is calculated from top to bottom on the primary side of the page, then top to bottom on the secondary side of the page.”
There are certain SERP features, like AMP carousels, where Google features multiple pages in a single section. In cases like this, all URLs in a single element are counted in the same position.
“Average” position also means that this metric doesn’t represent exactly where you rank on the page at a precise time. If your URL appeared in position 3 one day, 7 the next day, and 4 the next day, the URL would show an average position of 4.6.
Now that you understand the four main metrics in Google Search Console’s Performance report, it’s time to dive into grouping and filtering.
You can group your data by five different categories: queries, pages, countries, devices, and search appearance.

Grouping your data by “queries” shows you your metrics for different keywords. For example, if your page was showing up for the keyword “office supplies,” this view allows you to see how many clicks, impressions, etc. your URL is getting for this specific keyword.
Grouping your data by “pages” gives you an itemized list of all your URLs and how many impressions, clicks, etc. they’re getting in SERPs.
Grouping your data by “countries” shows you how many clicks, impressions, etc. you’re getting from particular countries. For example, you might be getting 500 clicks from the U.S. and 100 from Canada.
Grouping your data by “devices” shows you how many clicks, impressions, etc. you’re getting from the different major types of devices. For example, you might find that you’re getting 1,000 clicks on desktop but 2,000 from mobile and 500 from tablets.
Grouping your data by “search appearance” shows you how many clicks, impressions, etc. your URLs are getting based on how they show up in search. For example, you might see that you’re getting 100 clicks from AMP articles and 200 clicks from Web Light results.
From any one of these group views, you can then layer on filters to narrow down what you see in your Performance report.

Say you wanted to view all your URLs that were performing in Google Image results or Google Video results. You could do that by switching the “Search type” from “Web” to “Image” or “Video”

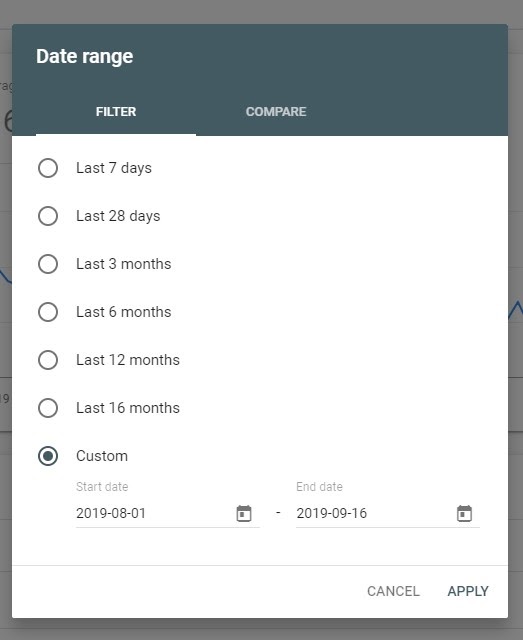
Say you wanted to view all your Performance data over the last seven days, the last year, or even a custom date range. You can set that using the “date range” filter.

This could be helpful, for example, if you want to see how your Performance may have fluctuated after a website change. Maybe you recently updated the content on a particular URL. Just set the date range to just before the change and right after the change to see how metrics like Impressions and average position improved or declined.
Want to see how you’re ranking for a particular keyword? Or all queries containing a certain word? You can do this with the “queries” filter.

If you only want to see data from a certain URL, or all pages from a certain subfolder on your site, you can do this with the page filter. In the example below, setting this type of page filter would show you all metrics from pages on your blog, provided that the URL structure of all your blog posts started with “/blog”

If you wanted to filter out all data except for what originated in the U.S., you can do that with the “countries” filter.

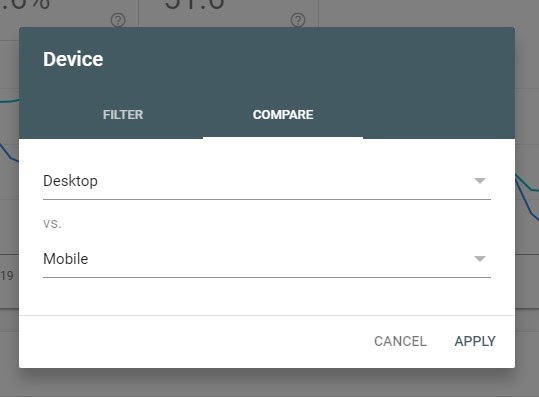
Only want to see Performance data from mobile? No problem. You can set that up using the “device” filter.

And finally, the search appearance filter is great for isolating how your URLs are performing when they show up in certain special features, such as AMP.

All of these filters give you the option to compare data as well. With this feature, you could compare your U.S. impressions to your Canada impressions, or your mobile clicks versus your desktop clicks. There are tons of use cases for the compare feature.
Also, keep in mind that you can add on multiple filters. So, for example, you could filter to show only data from the U.S. over the last seven days from mobile containing your brand name. Specific, but wildly useful in certain situations!
The best way to learn is by doing, so while this article can’t do the work for you, we can give you the next best thing — common use cases!
You can use Google Search Console’s Performance report to help you identify where you might have issues with your international optimization.
For example, you may have a website with multiple different country and/or language-specific sections. In order to ensure that U.S. searchers are getting served U.S. pages and Canadian searchers are being served Canadian pages, for example, you can set one filter to show you all your Canadian pages and another filter to show you only data from the U.S.

If pages from your “/ca” subfolder are being served to and clicked on by searchers in the United States, you may have a problem with your multi-regional targeting.
It’s common for businesses to want to know how their branded traffic compares to their non-branded traffic. You can accomplish this through query filtering in Google Search Console.
For example, if you want to view all your non-branded clicks, impressions, etc. just set your query filter to “Queries not containing {brand name}”

Another common use case for Google Search Console is monitoring performance during a big change, such as a website redesign.
For example, if you launched a redesigned version of your website in mid-August, you could set a custom date range of August 1st (to see a bit of data from before the redesign) to sometime after the redesign (such as the current date).

Doing this would allow you to see if there were any drop-offs in things like impressions and positions that coincide with the date you launched the redesign.
Google Search Console is a fairly intuitive tool, but like all tools with any sort of complexity, questions are bound to pop up. Here are some of the most common questions we hear about Google Search Console data, and what you need to know about them.
Google Search Console does limit how much data you can see to 1,000 rows in their free, native tool. However, they have an API that allows you to export all of your data, which is pretty great! It’s why we chose to integrate with Google Search Console’s API to create RealKeywords.
To see all your data, you’ll need to work directly with the Google Search Console API or use a tool that pulls that in for you, like Botify Keywords.
In Google Search Console, you can still see data for queries where you’re not ranking on average on page 1. Take the example below. I’m able to see data on these keywords even though the URL is at an average position in the 100s (~page 10).

Rank tracking solutions that let you force-track keywords (track keywords manually even if you’re not showing up for them) can be time-consuming, especially on large sites with millions of URLs.
If you want to rank for a keyword that’s not showing up in your Google Search Console Performance report, ask yourself the following questions:
Typically, if the query is searched often enough and you have a high-quality, crawled page on that topic, you should be seeing some data for it in Google Search Console.
You may also find this article helpful: How to Check What Keywords Your Site Is Ranking For.
Some people may hate on the “average position” metric in Google Search Console, but we love it. Let me tell you why.
If you’ve been in the SEO industry for any length of time, you’ve undoubtedly gotten questions like: “I see us ranking in position 4 for {keyword}, but yesterday we were in position 2. What happened?”
Usually what follows is you frantically opening an incognito tab, typing in the query, and counting what position the site is ranking in. In many cases, the SERP that you’re seeing is different than what someone else is seeing. This is because of factors like personalization and localization.
Google can modify what your search results look like based on your account history (for example, if you’re logged in) as well as your physical location. With all these subtle variances in position by time of day, location, and personal history, it’s fair to say that it’s impossible to have a single source of truth when it comes to what position you’re ranking in.
So instead of spending time reconciling the difference between what you’re seeing and what someone else is seeing on a certain day, average position is an option that results in far less hair-pulling.
Another benefit to tracking your position in Google Search Console is that you get to layer it with other data, such as clicks. If you have Botify Keywords, you can go a step further and layer your keyword data with any other SEO metric, including log files and crawl data! You can read more about that in our article Keyword Tracking for Enterprise SEO.
This adds helpful context to keywords. For example, moving down one position might turn out to be not so bad if you learn that you’re actually getting more clicks in that position. And you may be better able to understand why you’re ranking in a lower position if you can layer on data points like content uniqueness to your rankings.
Keyword data is only as helpful as the context surrounding it. For example, would you rather know that your position for a keyword moved down five spots since yesterday? Or would you rather know that your position for a keyword moved down because that page’s content changed, a title tag was modified, or any other factor you could think to monitor?
If layering your keyword data with your other SEO metrics is something that you’d like to explore, we’d love to show you how it’s done! Just visit Botify.com/Demo and we’ll get one set up for you. You can also tweet your questions about the GSC API or Botify Keywords to @Botify.


Sign up for our monthly newsletter.


