Crawl Speed: How Many Pages/Second? 7 Points To Take Into Account
Crawl & Render Budget
Search Engine News & Info


 Jeff
Jeff
Google Search Console has great data and tools to manage your website’s relationship with Google, from search analytics to sitemaps.
As part of our ongoing series in response to Google’s most recent detailed explanation about Crawl Budget, we’re going to show how you can complement Google Search Console crawl reporting with SEO insights from Botify.

The Google Search Console Crawl Stats section has three charts accompanied by minimum, maximum, and average values for the preceding 90-day period. The charts cover crawl volume, bandwidth, and speed. Below is a screenshot of a full report:
This is great to get a general sense of Googlebot’s activity. Let’s explore how to make it actionable. We’ll focus on pages crawled per day and time spent downloading pages.
The Google Search Console crawl stats chart of pages crawled per day is an interesting one because you can see whether Googlebot crawl activity is trending up or down, its peaks and valleys.
This chart may open questions that today can only be answered by analyzing your server logs.
But not all of that crawl may not be on “pages” as we generally think about them (an HTML document that can be found at a URL that can be crawled and indexed). In general, most of that crawl is on pages. As we will see below, the totals in the example are only about half the crawl shown in the GSC Pages Crawled Per Day chart.
Some of the Crawl Budget is spent on static resources, such as JavaScript, CSS, or image files. Google wants you to allow it to crawl JavaScript and CSS resources so that it can render and fully understand your pages. If you allow it, you should understand whether it’s being crawled and how much Crawl Budget it is consuming.

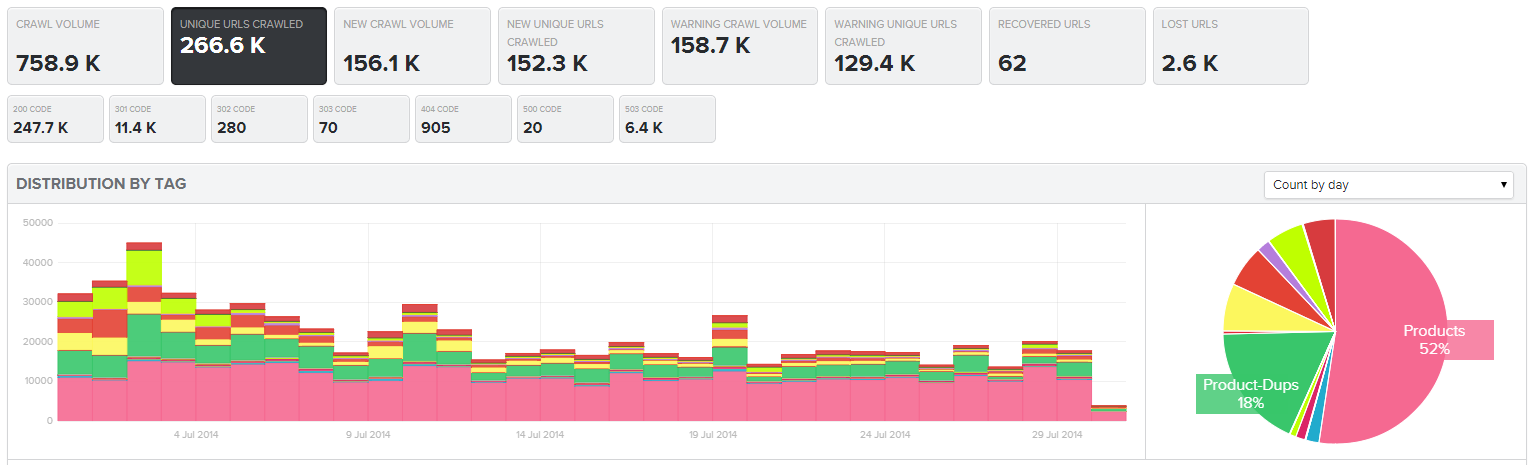
The crawl stats chart for this website, below, shows a robust amount of crawl activity, averaging 240,000 pages crawled per day with peaks of about 800,000.

The crawl trend in Botify Log Analyzer has a shape similar to the Google Search Console trend: the crawl volume of URLs is only about half of what we see in GSC.

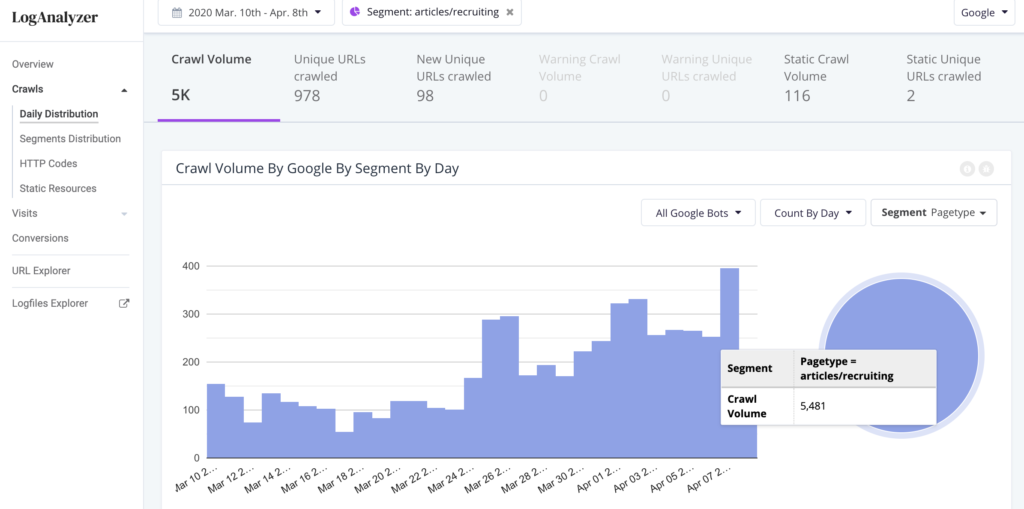
The balance is from crawls of JavaScript resources, peaking at more than 350,000 crawls on one day (the same JS file is requested with slight variations in query parameters) as seen here:
Botify Log Analyzer Static Resource Crawl Volume For A Travel Site
The crawl of static resources is consuming 46% of the overall Crawl Budget!

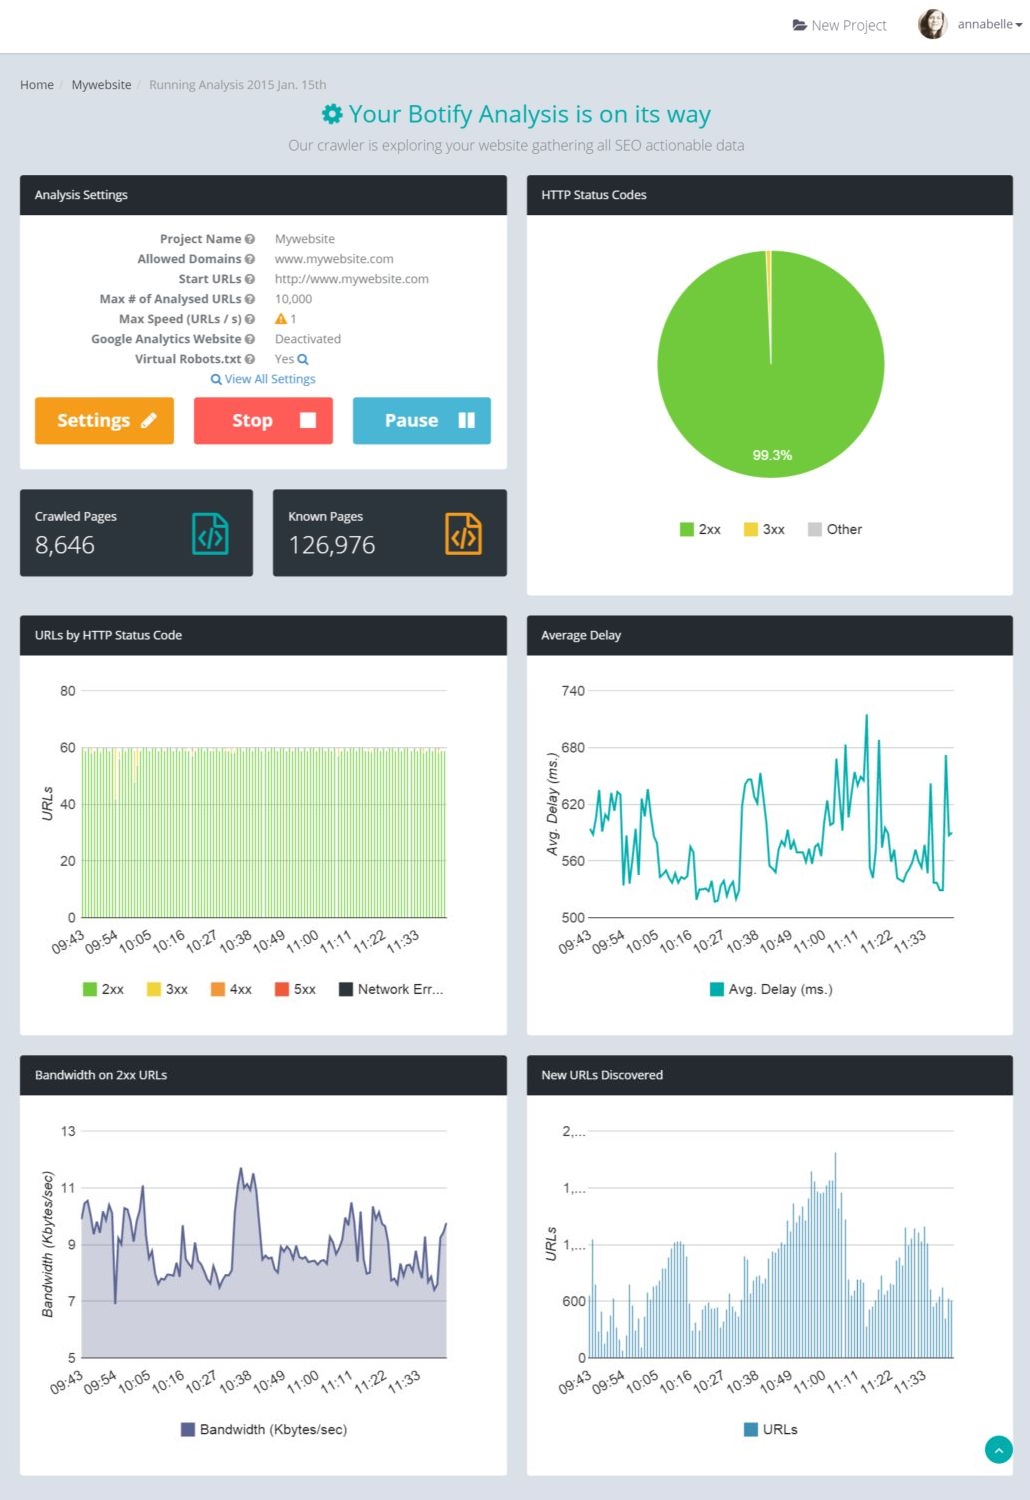
For the most part, you want to see crawl activity happening on pages that return a 200 or 304 HTTP status code. When you are analyzing server log files for SEO, you can quickly see how much of the crawl is being consumed by good or bad status codes and whether that’s improving or not.
Botify Log Analyzer crawl by HTTP status code by day
Google also provides a list of URLs for which it encountered errors. We’ll go into more detail on that report in the next article.
This trend indicates whether there is room for improvement in download speed of your pages. It is not a full representation of performance for your user experience, but the longer it takes just to download the HTML, the more likely it is your users are experiencing slow pages, too.
From a crawl perspective, the faster Googlebot can download your pages the more it will be able to crawl in the course of a day. Site speed is also one of the many ranking factors. Moz has published research showing a relationship between time to first byte and rankings.

Below is a screenshot of the performance trend for a website.
Google Search Console trend of time spent downloading a page

In this example the average time spent downloading a page was 441 milliseconds. In Botify Analytics we can use that average as a filter to understand what might be driving that and on which pagetypes.
Botify Analytics report filter combining download delay and Google crawl

The table below segments crawled URLs into those faster than Googlebot’s average download time and those slower. We can see that in each case time to first byte is the main driver for slow performance for this site: 86% of the download delay for slower than average pages and 78% for faster than average pages.
Botify Analytics metrics table using crawl download time filters

Applying the filter for URLs Google crawled and that were slower than average, we should be concerned that the shallower parts of the site are slower than the deeper ones, since these are among the most important pages in the site.
Botify Analytics Download Time by Depth for slower-than-average URLs crawled by Google
Looking at Download Time by Pagetype for URLs crawled by Google, it’s clear that all the pagetypes need improvement (which makes sense since time to first byte is the main driver), but the “Detail” pagetype has a greater share of the slowest loading pages. That might be a good template to start working on.
Google Search Console’s crawl stats are great starting points for deeper exploration of where and how to optimize your site’s Crawl Budget. Log file analysis for SEO will expand on those indicators so you can identify and prioritize opportunities to improve your SEO performance.
Just getting started? Read other recent articles about Spending Crawl Budget and Crawl Ratio.
Share your experience or results of optimizing Crawl Budget using Google Search Console data in the comments below!
Want to learn more about what Google Search Console can do? Check out our article “The Ultimate Guide to GSC Keyword Data.”

Sign up for our monthly newsletter.


